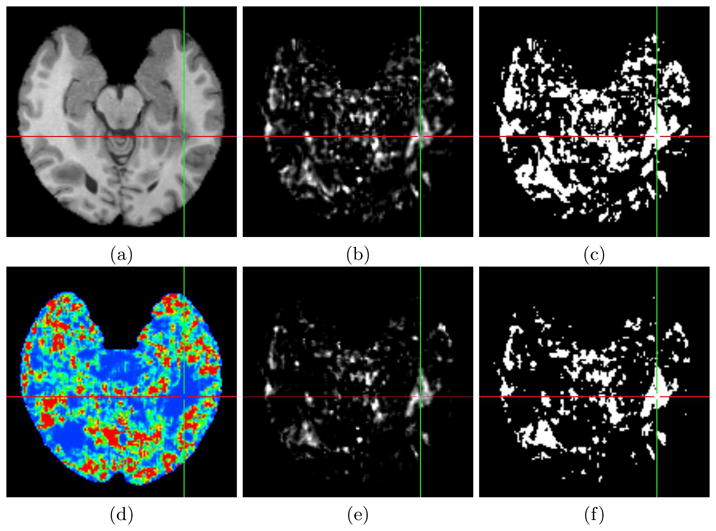
Fig. 2. Qualitative Comparison on Real MS Patient Images
Comparison of the score maps (Eq. (3)) and differences detected by the two methods M 1 (b,c) and M 2 (d–f). (a): T1 image of a patient, (b,e): score maps for M 1 and M 2, (d): number of patches kept for each voxel by M 2 (from blue: low number, to red: large number), (c,f): differences detected at the 95% level.