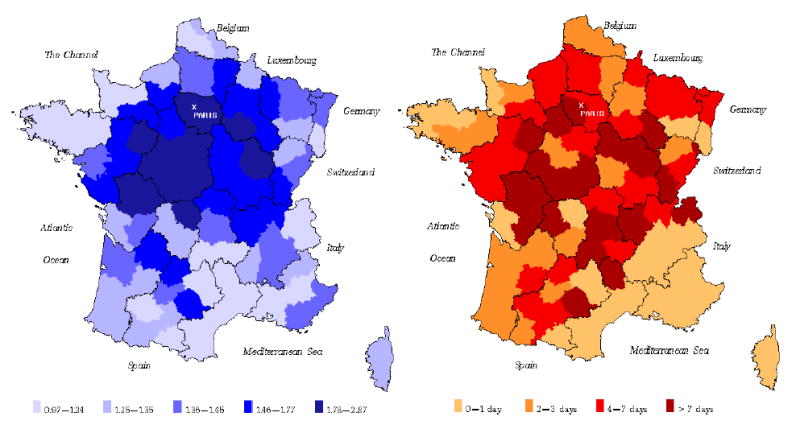
Figure 2. Geographic distributions of mortality ratios O/E (left map) and the number of “very hot days” (right map) by Departement in France - August 1st to 20th, 2003
O: observed number of deaths; E: expected number of deaths; O/E: mortality ratio. The mortality ratios have been grouped into five classes containing approximately equal expected numbers of deaths.
The 96 French departements have been grouped into four classes on the basis of the number of “very hot days”. Number of “very hot days”: number of days on which the minimum and maximum temperatures simultaneously exceeded the corresponding 30-year averages by 5 and 9°C, respectively, between August 1st and 20th, 2003.