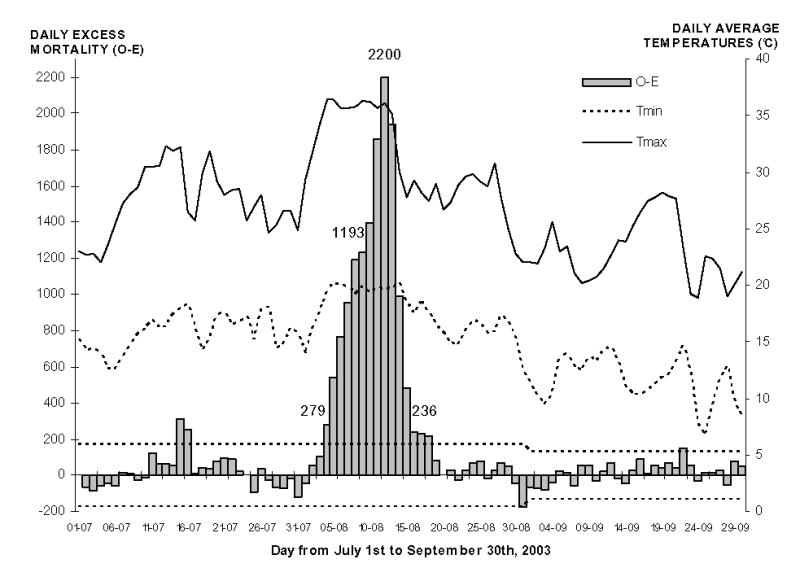
Figure 1. Number of excess deaths observed during the French heat wave from July to September 2003 and average daily maximum (Tmax) and minimum (Tmin) temperatures recorded during the period
The X axis shows the 92 days from July 1st to September 30th 2003. The histogram shows the numerical values of the daily excess mortality for August 4, 8, 12 and 16.
The dotted horizontal lines show the limits of the 95% fluctuation intervals of the daily number of deaths.