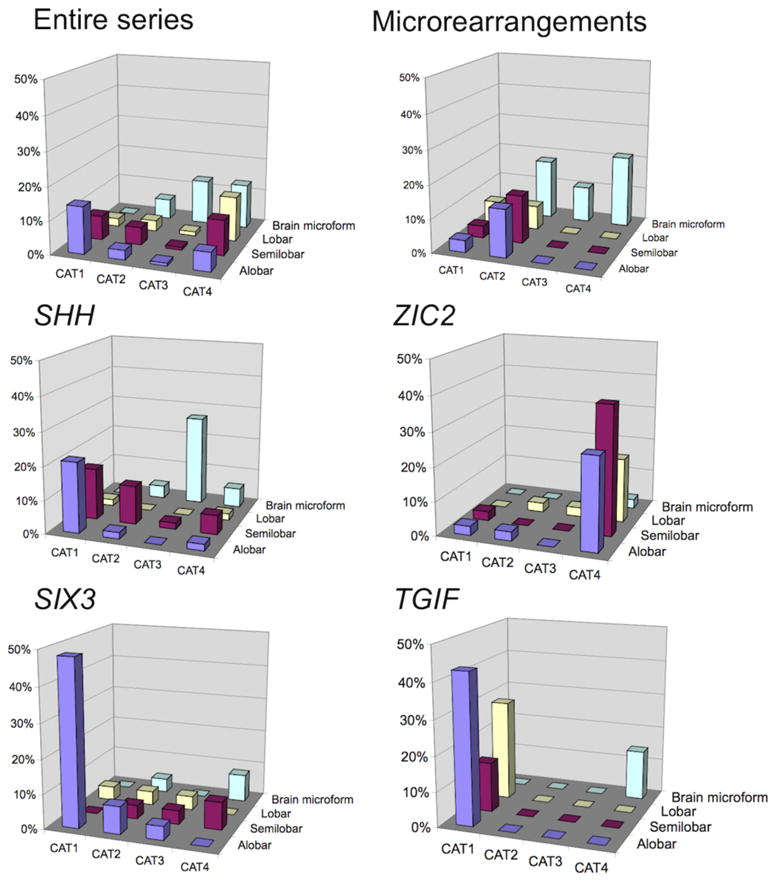
Figure 3. Face defect category, as a function of HPE type, for the series as a whole, probands with abnormal array-CGH findings and with altered SHH, ZIC2, SIX3 and TGIF genes
The results presented are based on the data for 369 informative probands. Considering a positive gradient of severity from category 1 to category 4 in Spearman’s rank correlation test, we found a significant correlation between the severity of HPE type and facial features for the entire series (p<0.001) and for the SHH (p<0.001), SIX3 (p<0.001) and TGIF (p<0.001) subgroups, but not for the ZIC2 subgroup (p=0.5).