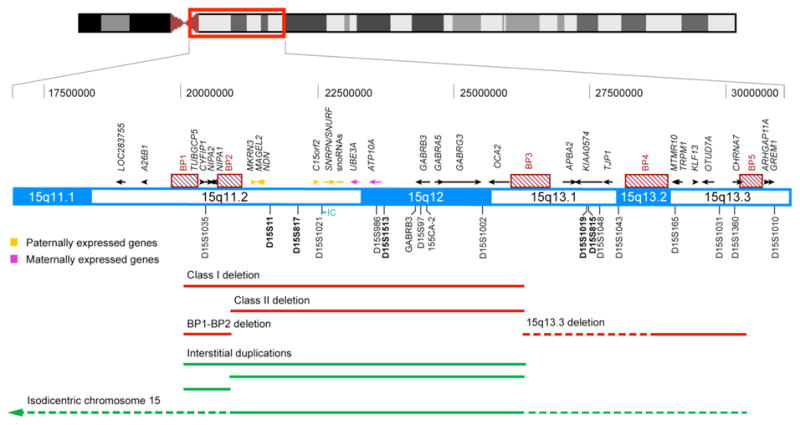
Figure 1.
Map of chromosome 15 showing the Prader-Willi/Angelman syndrome critical region. Genes are shown above the map and microsatellites below. The five microsatellite markers used in the quantitative analysis are indicated in bold. Paternally and maternally expressed genes are indicated in yellow and pink, respectively. The recurrent breakpoints (BP) are indicated as purple boxes. The imprinting center (IC), located in the 5′ untranslated region of SNRPN, is indicated in green. The horizontal red bars indicate the regions deleted in Angelman and Prader-Willi syndromes (class I and class II deletions), as well as the recently described copy number variant between BP1 and BP2 and the 15q13.3 microdeletion syndrome. The horizontal green bars indicate the regions involved in typical interstitial duplications and supernumerary isodicentric chromosome 15. The critical region for Prader-Willi, Angelman and 15q11-q13 duplication syndromes lies between BP2 and BP3. The distance (expressed in Mb from pter) is shown at the top of the map.