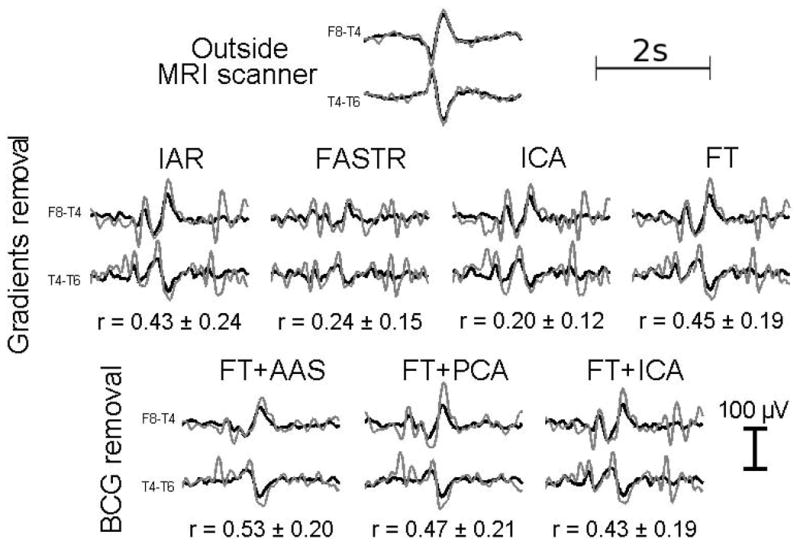
Figure 7.
Spike morphology. Top line: One interictal spike (in grey) and the average over ten interictal spikes (in black) recorded outside the scanner. On the middle and the bottom lines, the same interictal spike (in grey) and the average over the same ten spikes (in grey) are plotted after imaging artefact correction and after cardiac artefact correction (following FT imaging artefact correction), respectively. The mean and standard deviation of the cross-correlation coefficient r between the 10 spikes recorded outside the scanner and the 10 spikes estimated after correction are indicated for each correction method.