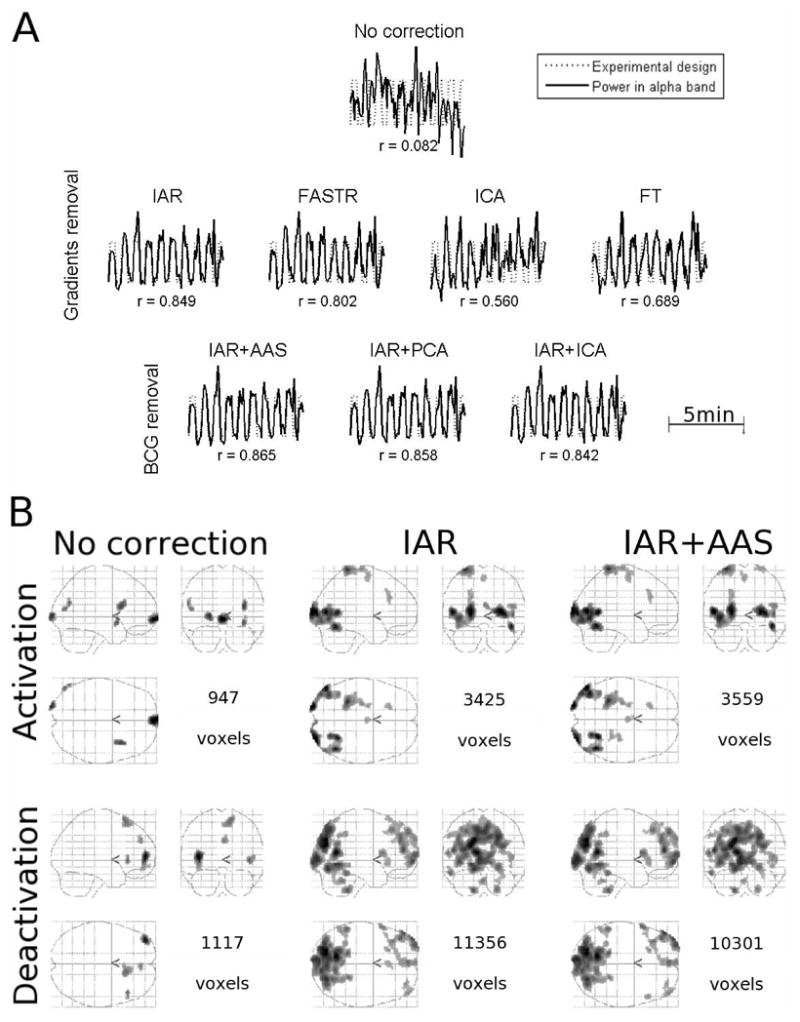
Figure 6.
Alpha rhythm imaging. (A) Comparison between the experimental block-paradigm (eyes closed/eyes open) and the normalised power in the alpha band. Top line: no artefact correction. Middle line: imaging artefact correction. Bottom line: cardiac artefact correction after using IAR imaging artefact removal. To get a picture of the accuracy of the estimated EEG, the cross-correlation coefficient r between the paradigm and the alpha power is indicated below each plot. (B) Glass brains obtained using the power in the alpha band as a regressor convolved with the hemodynamic response (p = 0.005, uncorrected). Left: without any artefact correction. Middle: using IAR imaging artefact removal. Right: using IAR imaging artefact removal and AAS cardiac artefact removal. As an indication, the number of voxels activated (top line) or deactivated (bottom line) is indicated for each glass brain.