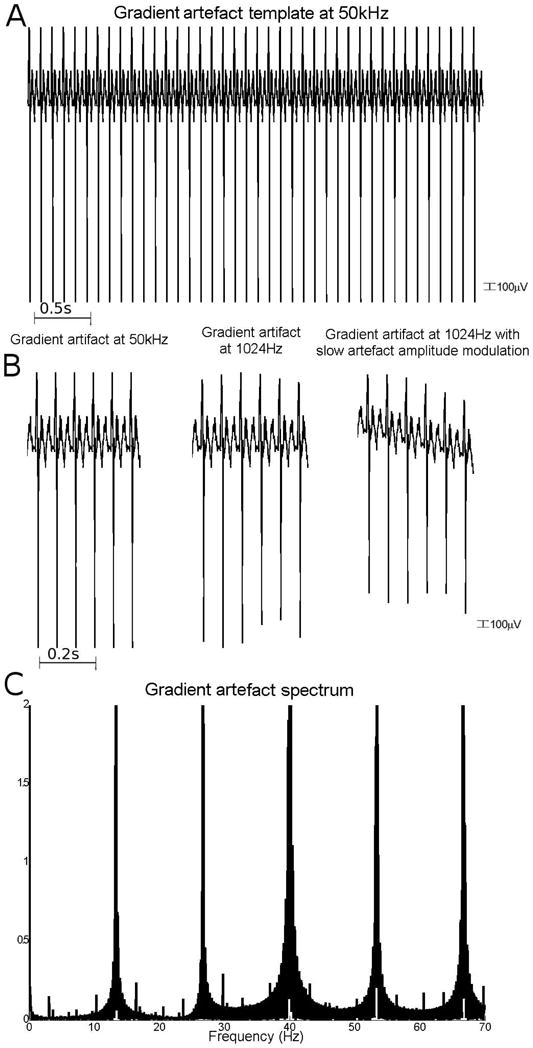
Figure 2.
Construction of the model of imaging artefact. (A) Imaging artefact template for a volume sampled at 50 kHz (TR= 3 s, 40 slices per volume). (B) Left: Zoom on 6 slices of the imaging artefact template (50 kHz as in A). Middle: Imaging artefact template after down-sampling at 1024 Hz. The down-sampling introduces some irregularity on the shape of the artefact, which violates the assumptions of most correction methods. Right: Imaging artefact template after down-sampling at 1024 Hz and modelling of the artefact amplitude modulation. (C) Spectrum of the imaging artefact between 0 and 70 Hz sampled at 1024 kHz. It shows aliasing, which can be important when the EEG sampling rate is too short.