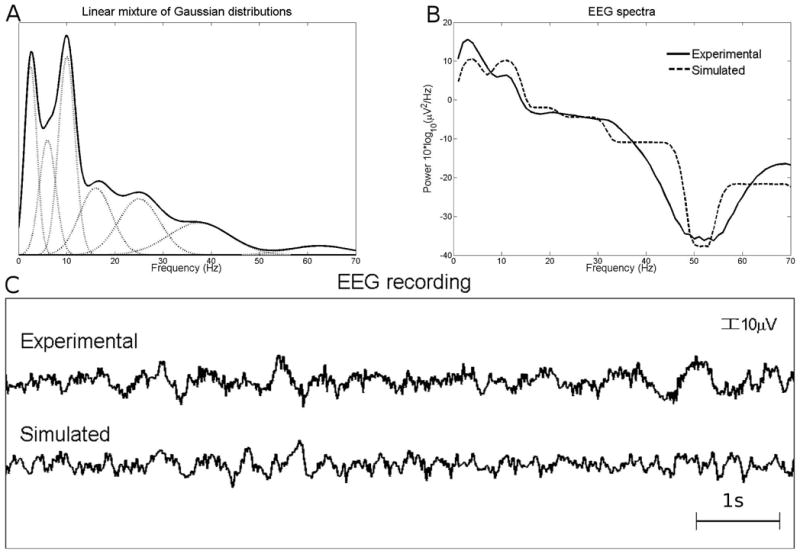
Figure 1.
Generative model of EEG. (A) Addition of the 7 Gaussian distributions in various frequency bands to emulate a realistic EEG spectrum. (B) Comparison of the log-spectrum between simulated (dotted line) and experimental EEG (plain line). (C) Example of EEG time series recorded outside the MR scanner (upper recording) and a realisation of synthetic EEG time series (lower recording).