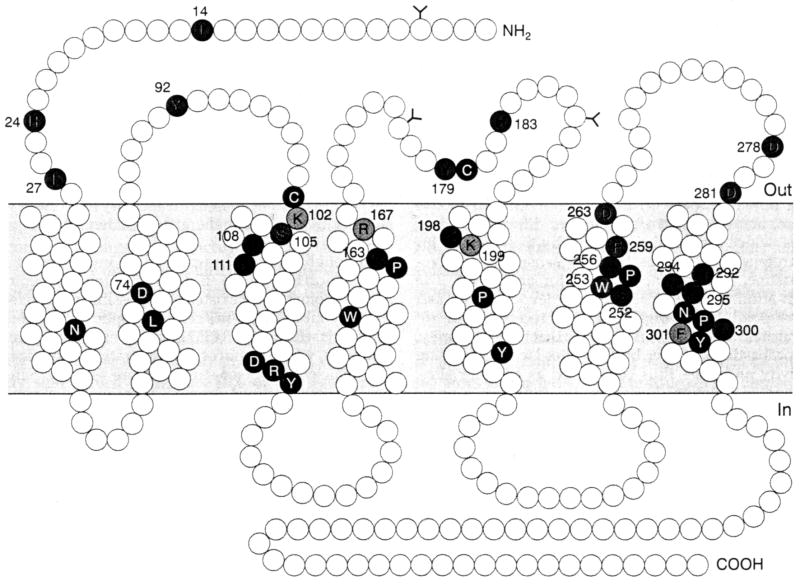
Figure 1.
Schematic structure of the angiotensin AT1 receptor showing agonist and antagonist binding sites identified by mutational analysis. Amino acids involved in nonpeptide antagonist binding are shown as pink circles, while those implicated in angiotensin II binding are shown as blue circles. Yellow circles indicate residues implicated in both agonist and antagonist binding. The highly conserved fingerprint residues are shown as white letters on black or coloured background. Potential glycosylation sites are also indicated. (Modified from Ref. 14.)