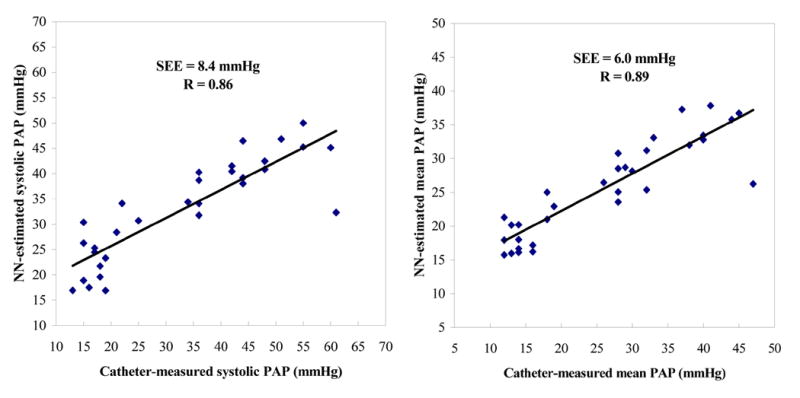
Figure 7.
Correlation between the systolic (panel A) or mean (panel B) PAPs estimated using the NN method and directly measured by catheter. Each point represents the average estimate obtained from 15 to 50 S2 recorded during a given PAP condition (normal PAP, moderate hypertension, severe hypertension, back-to-normal PAP) in 9 pigs. The solid line represents the regression line.