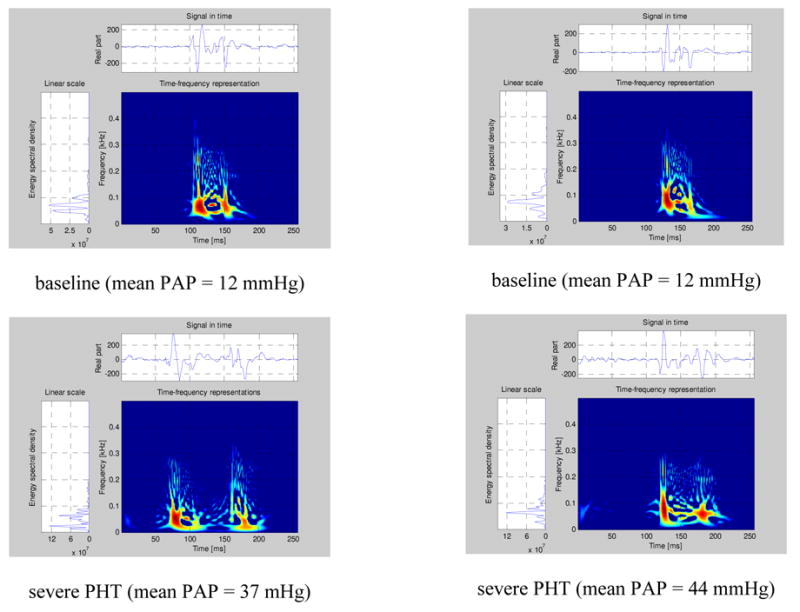
Figure 4.
Examples of Pseudo-Smoothed Wigner-Ville Time-frequency representations for two pigs (left panel pig 1, right panel pig 2) for normal pulmonary artery pressure and for pulmonary artery hypertension.
Figure 4.
Examples of Pseudo-Smoothed Wigner-Ville Time-frequency representations for two pigs (left panel pig 1, right panel pig 2) for normal pulmonary artery pressure and for pulmonary artery hypertension.