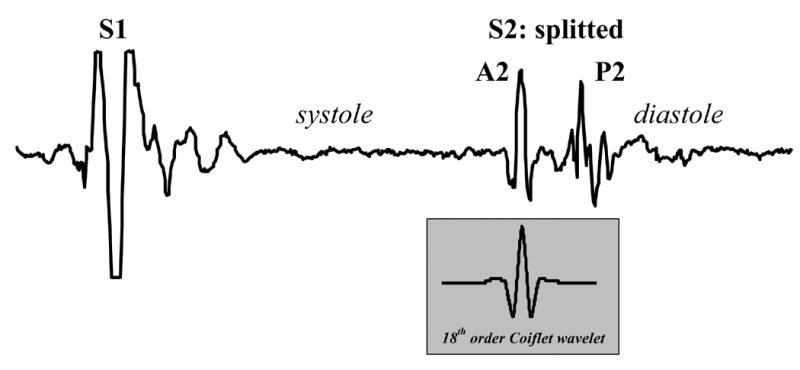
Figure 1.
Example of a PCG of one cardiac cycle. The amplitude of S1 was saturated to optimize the amplitude range of S2. The 18th-order Coiflet wavelet used in our study is presented for visual comparison with A2 and P2.
Figure 1.
Example of a PCG of one cardiac cycle. The amplitude of S1 was saturated to optimize the amplitude range of S2. The 18th-order Coiflet wavelet used in our study is presented for visual comparison with A2 and P2.