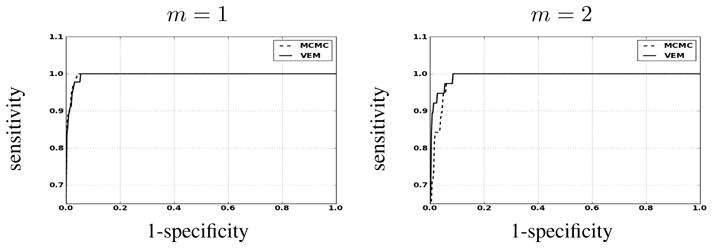
Fig. 4.
Detection results for the first artificial data analysis. ROC curves associated with the label posteriors (q̂ m ) using VEM and MCMC. Condition m = 1 is associated with a higher CNR than condition m = 2. Curves are plotted in solid and dashed line for VEM and MCMC, respectively.