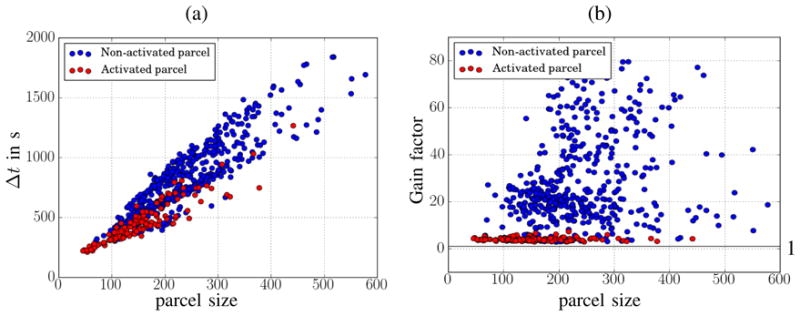
Fig. 16.
Comparison of durations for MCMC and VEM analyses in terms of parcel size, each dot coding for a different parcel. (a): differential timing Δt = t
MCMC −t
VEM. (b): gain factor Gf
= t
MCMC
/t
VEM of VEM compared to MCMC, the horizontal line indicates a gain factor of one (Gf
= 1). Circles are
 -colored for parcels estimated as activated, ie max{(μ̂
1
m
)1≤
m
≤
M
} ≥ 8 and
-colored for parcels estimated as activated, ie max{(μ̂
1
m
)1≤
m
≤
M
} ≥ 8 and
 -colored otherwise.