Fig. 11.
Reference (black) and estimated mean values of β with VEM (green) MCMC (blue) for both experimental conditions (m = 1 and m = 2). Mean values and standard deviations (vertical bars) are computed based on 100 simulations.
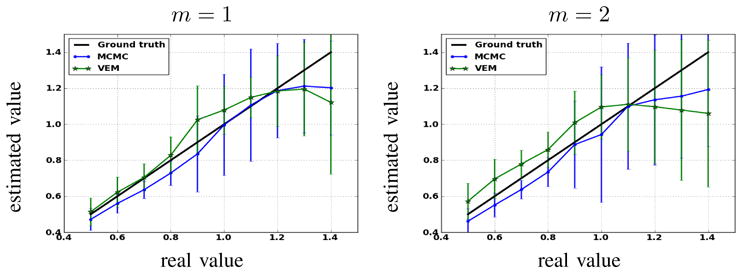
Fig. 11.
Reference (black) and estimated mean values of β with VEM (green) MCMC (blue) for both experimental conditions (m = 1 and m = 2). Mean values and standard deviations (vertical bars) are computed based on 100 simulations.