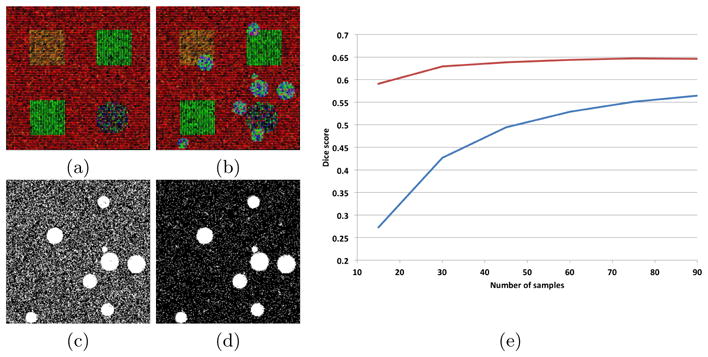
Fig. 1. Quantitative Detection Power on Simulated Data
Left: Illustration of one noisy reference database image (a) and the simulated lesions image (b), as well as results of detection utilizing 15 images from the database with M 1 (c) and M 2 (d). The right side (e) presents the dice scores obtained by each method as a function of the number of samples in the database. Legend: blue - M 1, red - M 2.