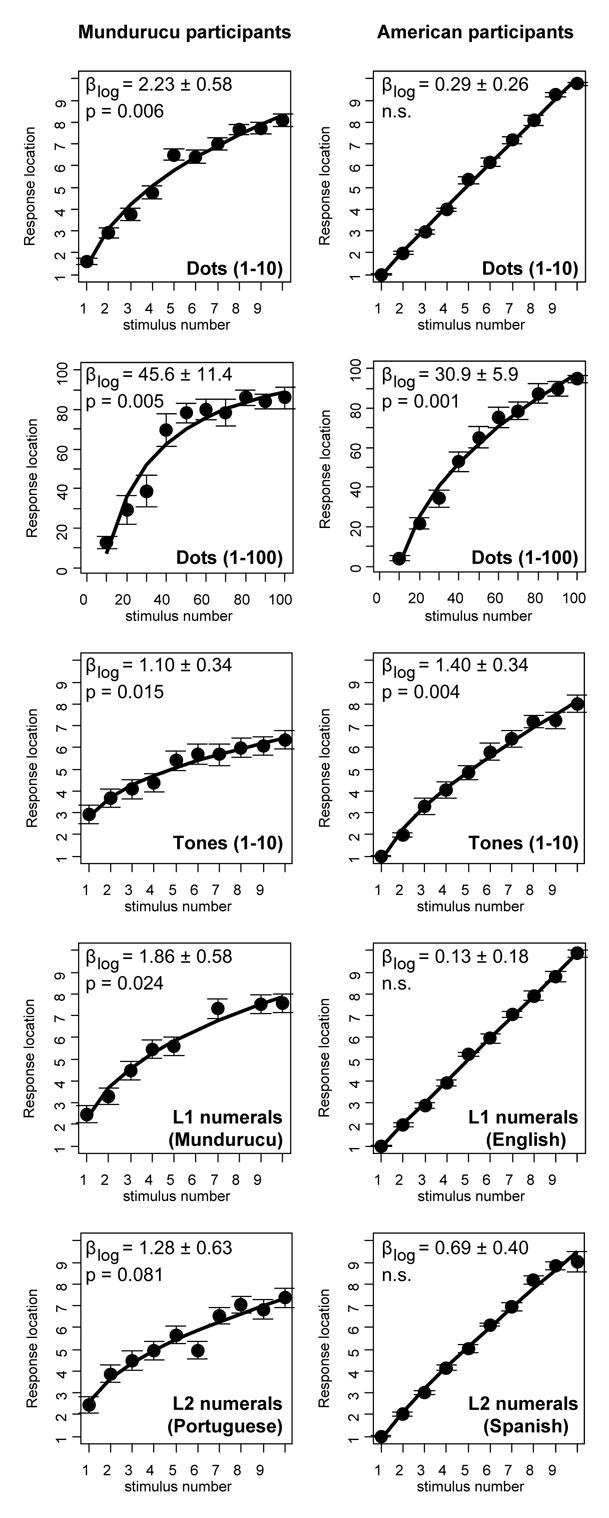
Figure 2.
Average location of numbers on the horizontal segment, separately for Mundurucu participants (left column) and for American participants (right column). Data are mean +/− standard error of the mean. Graphs of performance broken down by age group and education are available as supplementary material (24).